
When an API slows down after you add logs, the fix depends on whether building log messages is expensive or writing them makes the API wait.
We varied log volume, the way logs were written, and the speed of the output destination in the same API to compare how message-generation time and waiting to write affect responses.
After reading, you will know how to narrow down the delay in your own API by comparing “generate logs only” with “actually write the logs.” We also explain why, when moving writes to separate processing, you should check for unfinished logging work as well as response time.
What the experiment showed about waiting to write logs
We built a small API that writes one line of logging—a record of its activity—whenever a request arrives.
For the output destination, we used a test program that paused after receiving each chunk of log data. This created a situation where the destination could not keep up with the API's output. Log writes then had to wait, and some API responses took about three seconds.
The log line in this case was a long string of about 16KB (16KiB), formatted as JSON. It packed a lot of data into one line rather than being a short message. Even one log line could make the API wait, depending on how much it wrote and how quickly the destination could receive it.
We also tried separating log writing from the API's response handling. Responses became faster, but log reads continued for about two seconds after the final API response. Faster responses and completed log processing were separate outcomes.
For short, 128-byte messages, increasing output from one line to ten did not slow responses in proportion to line count under these conditions. Below, we compare the time to build logs, the time spent waiting to write, and the time to finish reading them separately.
Seven logging modes, one API
We used the Python 3.11.2 standard library. A small HTTP API running on a single asyncio event loop performed the same tiny hash calculation and returned the same JSON response. Only the following logging work changed.
| Mode | Work per request | Output bytes |
|---|---|---|
| No logging | Neither build nor emit a log | 0 |
| One short line | Synchronously emit a fixed short message | 128 |
| Ten short lines | Synchronously emit the same short message ten times | 1,280 |
| Generate JSON only | Build the JSON string without emitting it | 0 |
| Prebuilt JSON, synchronous output | Emit a JSON string created at startup | 16,384 |
| Generate JSON + synchronous output | Build and emit the JSON string on every request | 16,384 |
| Generate JSON + queued output | Build the JSON string on every request and hand off output to another thread | 16,384 |
Byte counts include the newline. The large JSON is fixed synthetic data consisting mostly of a long ASCII string. It is not a record of a real request, and we did not measure traversal of complex objects or masking of sensitive fields.
Synchronous output uses logging.StreamHandler; queued output uses QueueHandler and QueueListener. Both write to a dedicated FIFO, a pipe that passes bytes between processes. Following the StreamHandler behavior, the handler writes and flushes; a separate process reads the data.
We compared a reader with no artificial rate limit against one capped at 256KiB/sec. This is not a benchmark of durable disk writes or delivery to an external logging service.
- Application work
- Generate JSON
- StreamHandler
write and flush - API response
If the FIFO has no room, writing waits. A returned flush does not mean the receiver has finished reading everything.
- Application work
- Generate JSON
- QueueHandler
enqueue - API response
A separate thread continues through QueueListener → StreamHandler → FIFO → reader. JSON generation and enqueueing remain on the API path.
The QueueHandler documentation describes running handlers on a separate thread. In this experiment, JSON generation and the caller-side formatting and enqueueing remain on the request path. Only the output handler moves downstream.
Small differences for short messages; a large sink-dependent difference for JSON
We scheduled 20 requests per second, 50ms apart, for eight seconds, then observed all 160 requests through completion. Seven modes, two reader types, and three repetitions gave 42 runs and 6,720 requests. There were no HTTP errors, missing log data, or queue drops.
To examine delayed responses, we compare response times at the slower end as well as averages. For example, with 100 responses sorted from fastest to slowest, this is the time of the 99th response. Here it is calculated from all 480 requests pooled across the three runs of each condition. Timing starts at the scheduled send time and ends when the response body has been received. It includes connection setup and time spent waiting behind a stalled API.
| Mode | Fast reader | Slow reader |
|---|---|---|
| No logging | 3.54ms | 4.32ms |
| One short line | 5.24ms | 3.83ms |
| Ten short lines | 4.35ms | 4.10ms |
| Generate JSON only | 4.40ms | 4.51ms |
| Prebuilt JSON, synchronous output | 5.22ms | 2,912ms |
| Generate JSON + synchronous output | 4.42ms | 3,005ms |
| Generate JSON + queued output | 5.97ms | 4.86ms |
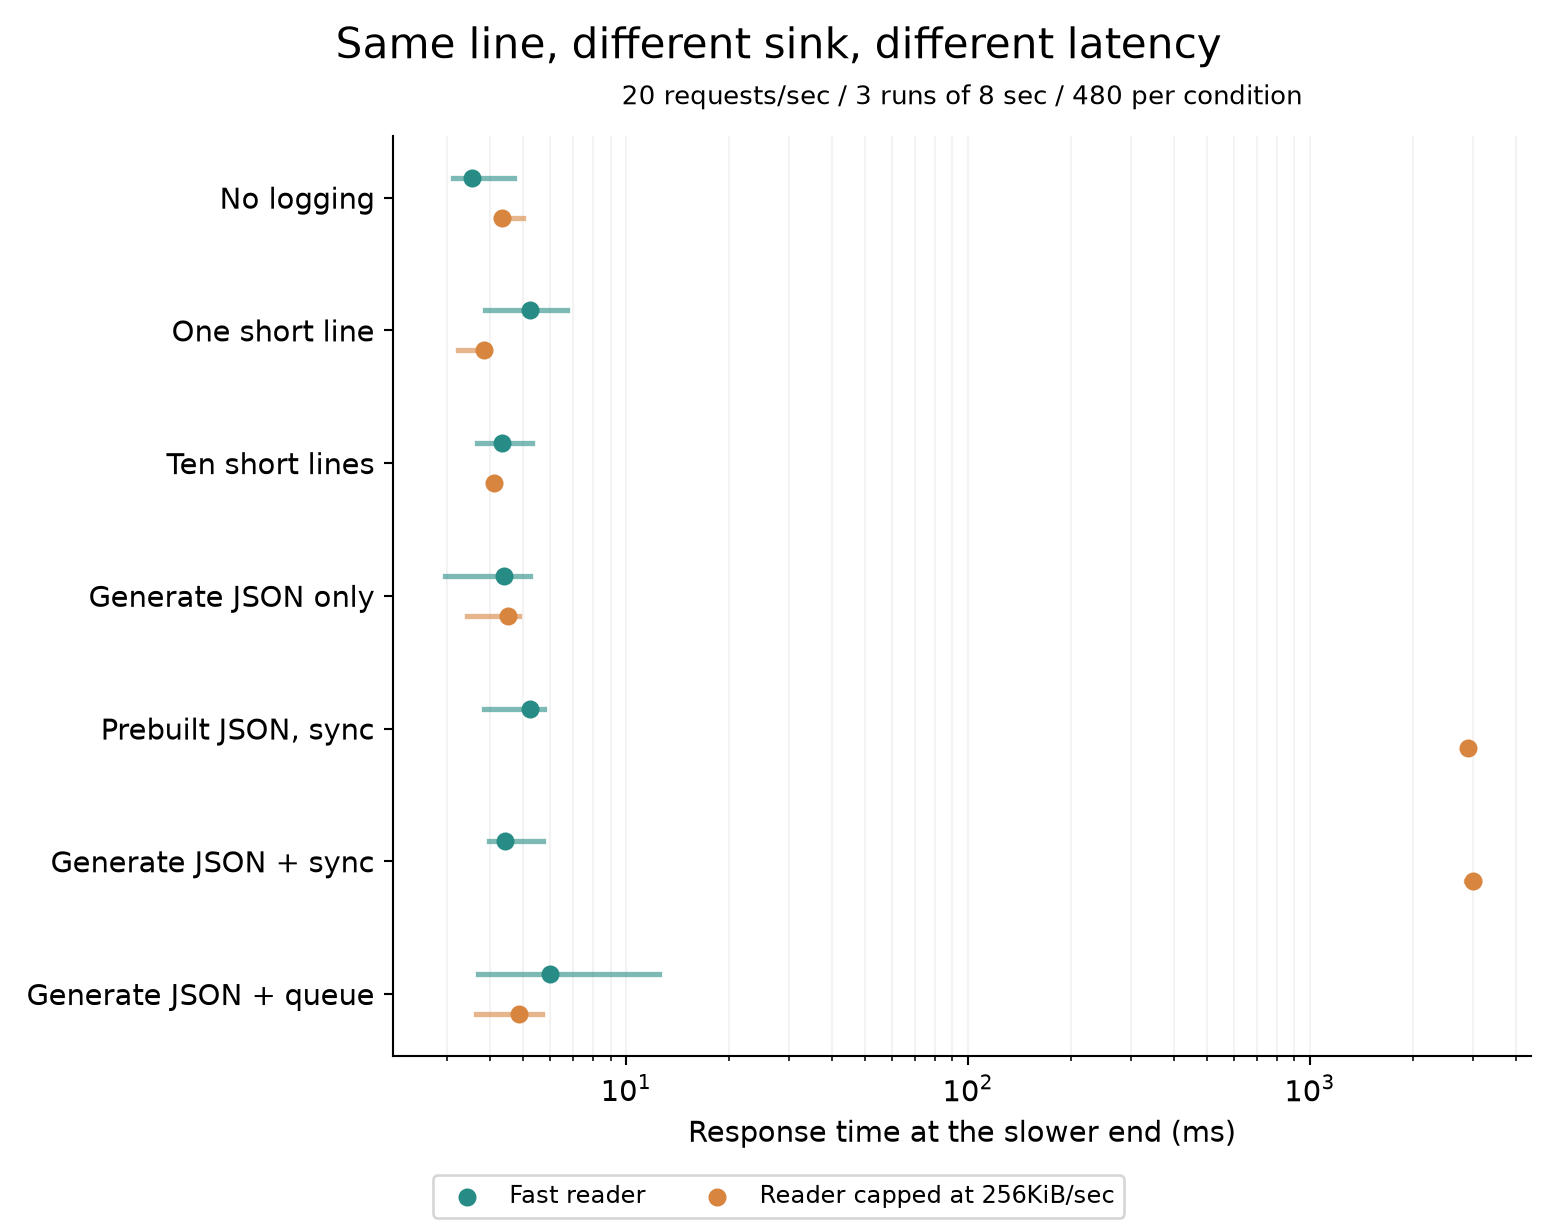
One line and ten lines do not rank in order of line count. With the fast reader, the values from individual runs ranged from 3.12–4.69ms without logging, 3.87–6.70ms for one short line, and 3.66–5.31ms for ten. The ranges overlap. This short experiment cannot establish a fixed number of milliseconds added by one short log line.
The clear difference appears when large JSON is synchronously written to the slow reader. With JSON generated on every request, the values from individual runs ranged from 2.87 to 3.13 seconds. Even prebuilding the string left the response time at the slower end at 2.87–2.96 seconds. Removing generation did not remove the seconds-long wait.
Waiting to write took longer than generating JSON
Inside the API, we also timed JSON generation separately from the logger call. With the slow reader, the means per request were:
| Mode | JSON-generation interval | Caller-side logging interval |
|---|---|---|
| Generate JSON only | 97µs | No output |
| Prebuilt JSON, synchronous output | No per-request generation | 55,319µs |
| Generate JSON + synchronous output | 105µs | 55,255µs |
| Generate JSON + queued output | 103µs | 122µs |
These intervals include instrumentation such as reading timestamps, counting bytes, and encoding strings. They are not measurements of the logger's isolated cost. An internal mean and the client-observed response time at the slower end are also different metrics. When one request blocks the event loop while writing, requests arriving in the meantime must wait too.
The requested output was 16KiB × 20 requests/sec = 320KiB/sec, above the reader's 256KiB/sec cap. The FIFO held 64KiB. Once buffers fill, a synchronous write waits; that wait can affect HTTP processing on the same event loop. This mechanism explains the observed result.
Ten short lines require only 25KiB/sec at this request rate, comfortably below the same reader cap. In this comparison, the byte volume and the speed of the receiver mattered more than the line count alone.
A queue moves the wait; logs remain after the response
With queued output and the slow reader, the response time at the slower end, pooled across runs, was 4.86ms for 480 requests, with individual runs ranging from 3.63 to 5.67ms. But the final API response did not mean that all logs had been read.
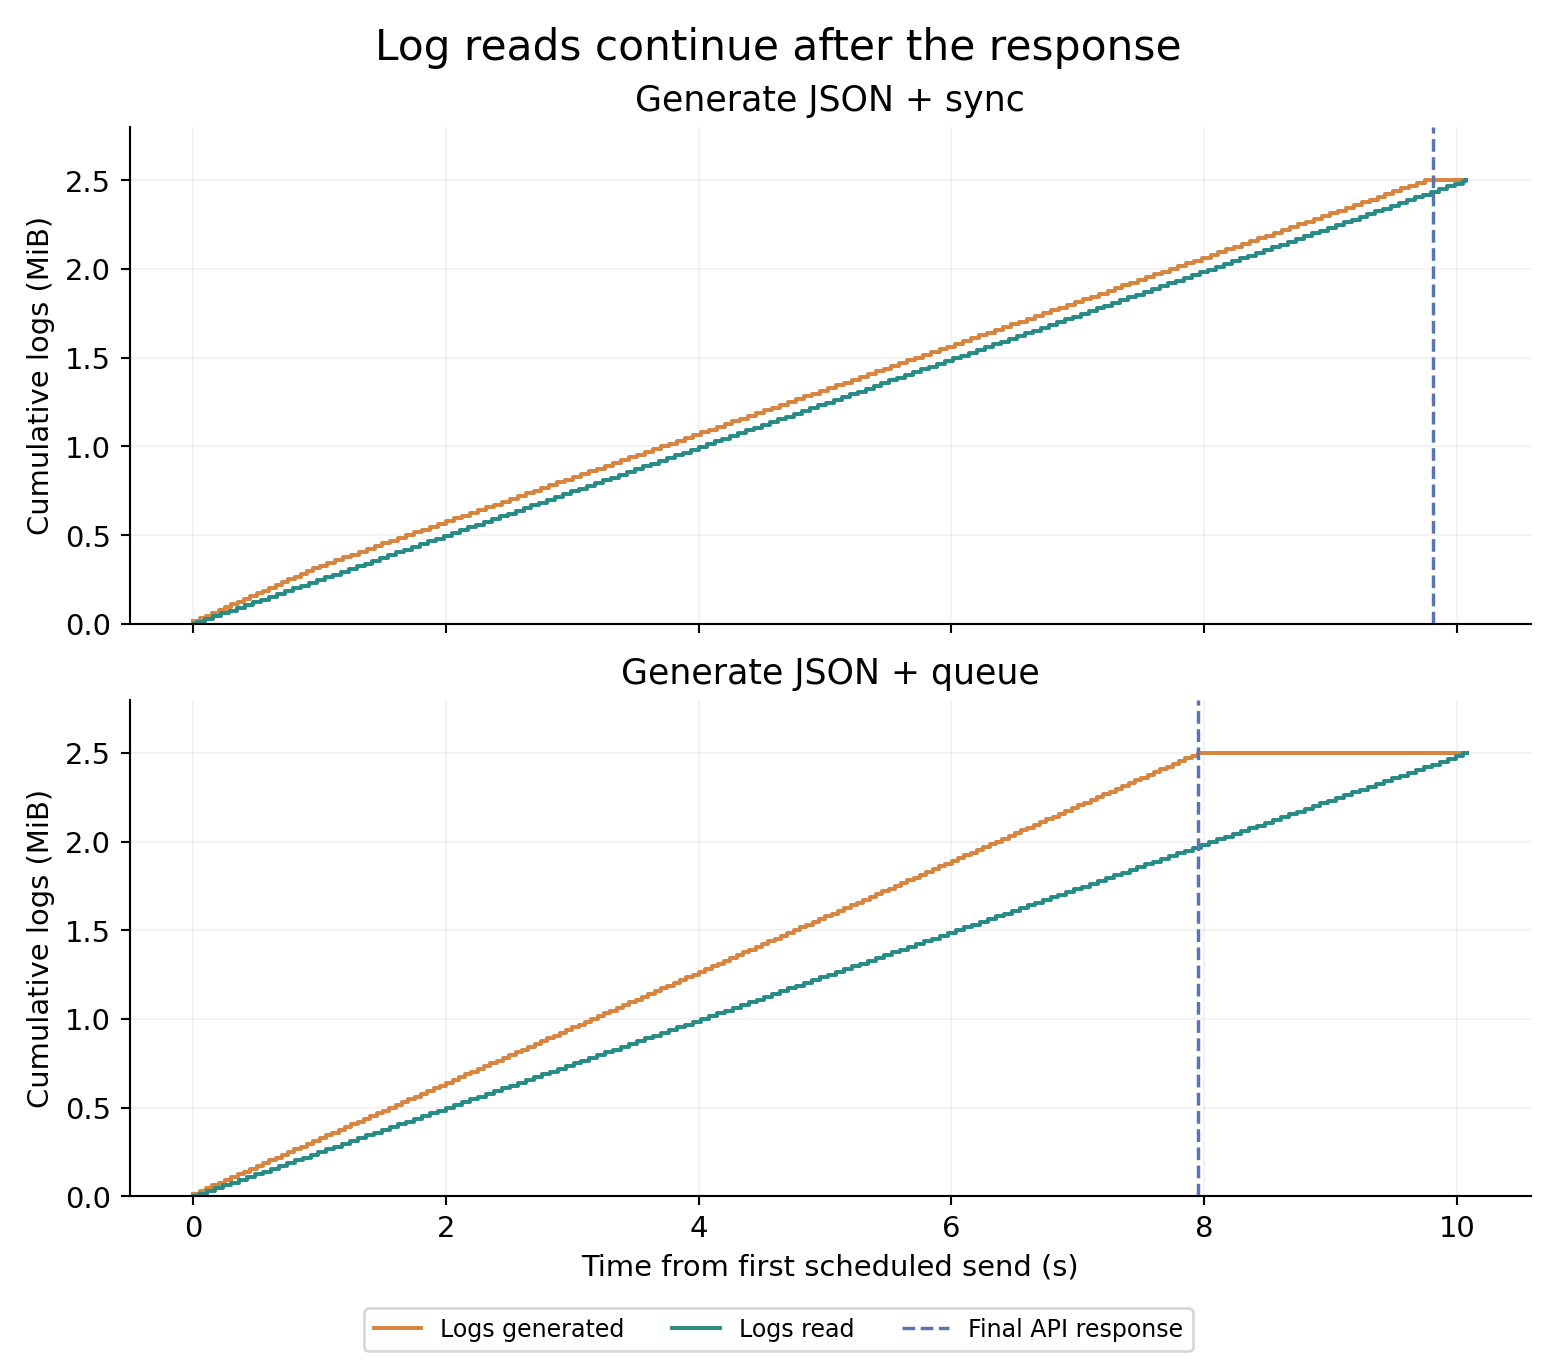
For queued output, the largest estimated difference between generated and read bytes was 548KiB. This estimate uses the preceding read sample, so it can overstate the unread bytes at that instant. It combines unread data in the application, FIFO, and queue; it is not a measurement of queue occupancy alone.
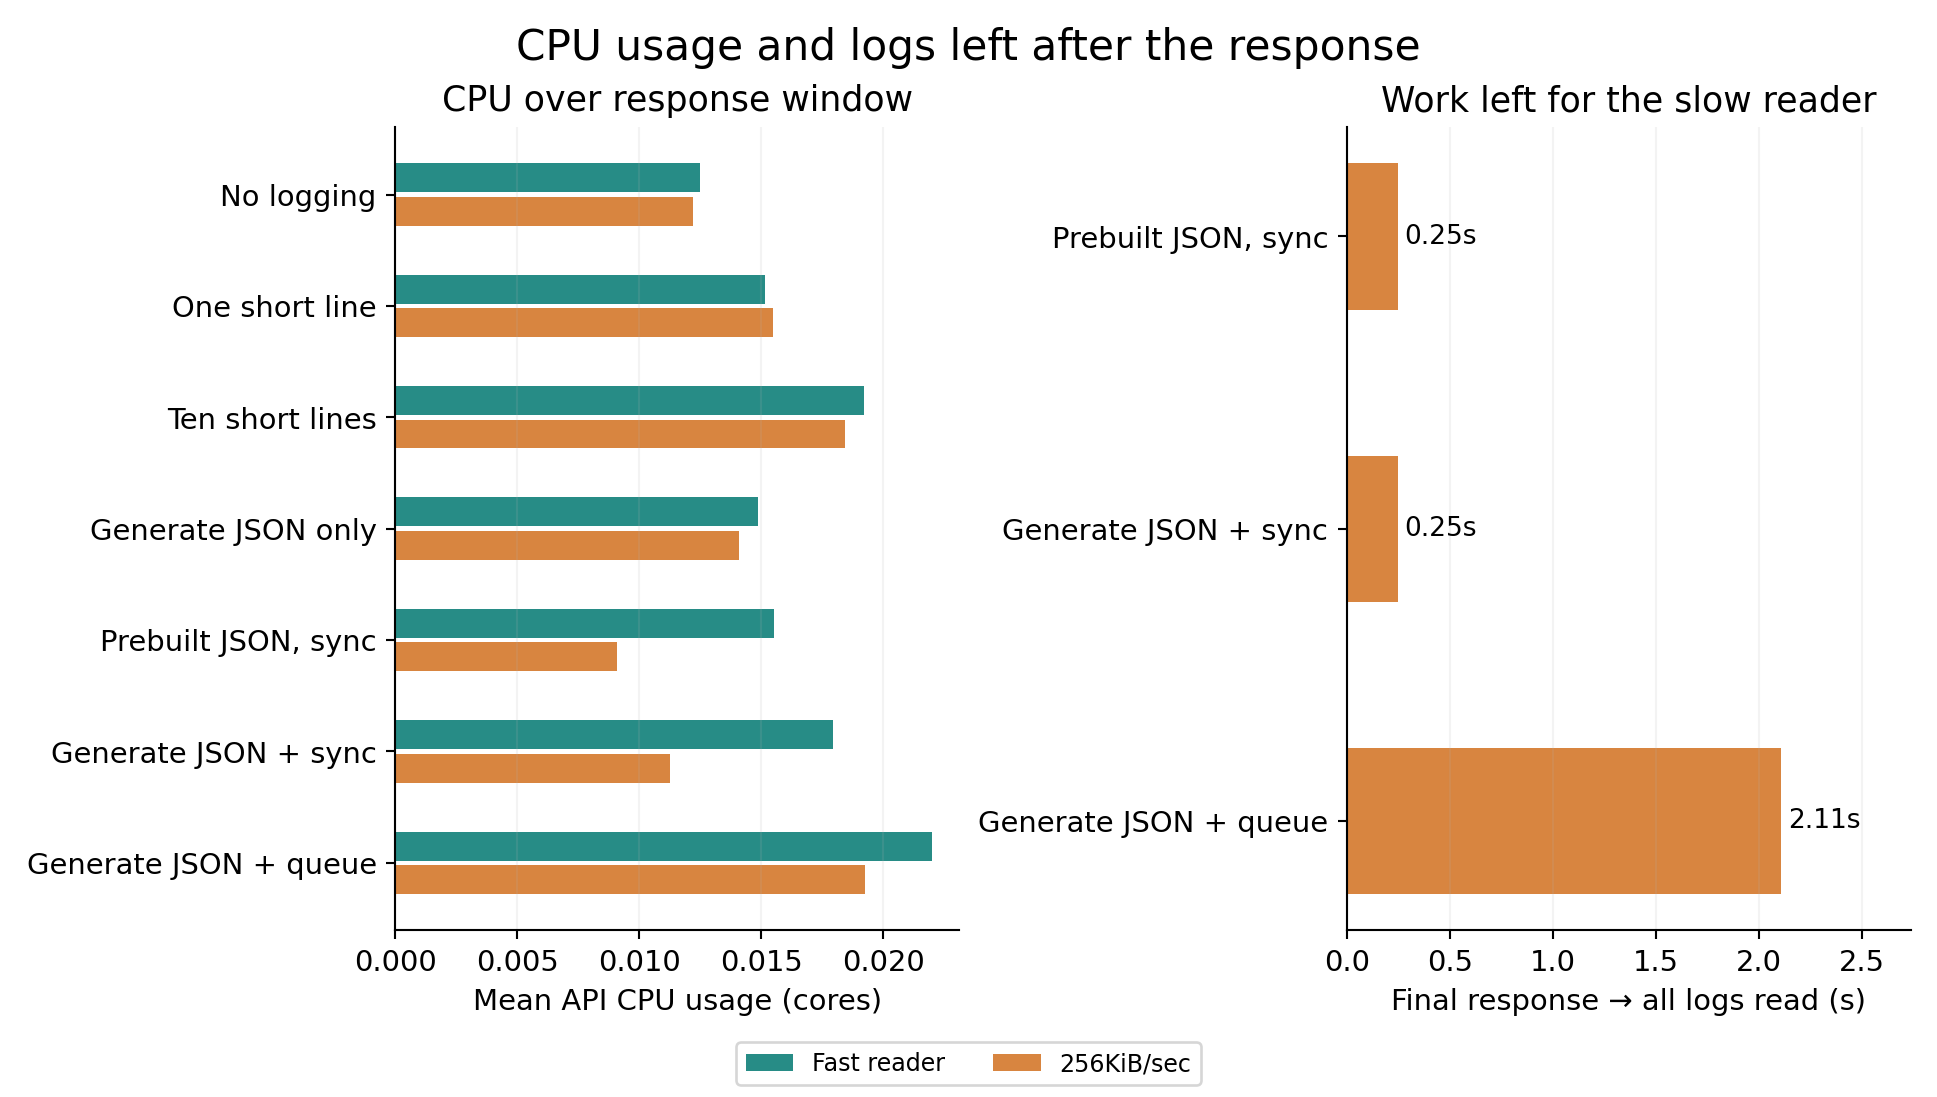
Reading all logs took an average of 2.11 seconds after the final API response, with all three runs between 2.10 and 2.11 seconds. Synchronous output left an average of 0.25 seconds. The synchronous approach waits before responding; the queued approach also leaves work after responding.
The queue limit was 256 messages. During this eight-second load it did not fill, and all log data was read without loss. If input keeps exceeding reader capacity, however, unfinished work will accumulate. We did not run a continuous load until the queue filled or measure responses at that point. The implementation treats a full queue or an output error as an experiment failure.
Low CPU usage does not guarantee fast responses
With synchronous JSON output to the slow reader, mean API CPU usage was about 0.011 cores. Queued output used about 0.019 cores. The synchronous approach, whose responses were delayed by seconds, had lower mean CPU usage.
That does not prove that the total logging work decreased. There is more time spent waiting for writes without using CPU, and the response-observation interval over which we average is longer. CPU usage alone cannot tell us where the API is waiting.
Completed requests per second also depend on what counts as completion. With 20 scheduled requests per second and the slow reader, the results were:
| Mode | Requests/sec through API completion | Requests/sec through completion of all log reads |
|---|---|---|
| Generate JSON + synchronous output | 16.29 | 15.88 |
| Generate JSON + queued output | 20.00 | 15.90 |
The first denominator runs from the initial scheduled send to the later of eight seconds or the last response. The second also includes completion of all log reads. We sum request counts and observation times across the three runs before dividing. No logging, one short line, ten short lines, and JSON generation only all completed API responses at 20 requests/sec. This compares how a fixed offered load finishes; it does not measure the API's maximum capacity.
What to check in your own API
In this experiment, the response time at the slower end alone did not let us reliably quantify the small extra cost of short messages. Large logs exceeding the output sink's capacity, however, clearly separated waiting on the API path from work left after the response.
If adding logs slows your API, comparing generation only, output of an existing string, and generation plus output can help narrow down the interval to investigate. Then check total bytes and output bytes per second, as well as lines per request. Output waits remain a candidate even when CPU usage is low.
When trying a queue, measure unfinished work, dropped messages, and the time to finish reading all logs alongside HTTP response time. If input exceeds the receiver's capacity, you will also need to revisit message contents, output volume, or reader capacity.
Measurement conditions, variation, and what this experiment does not establish
- Measured on October 29, 2026: Raspberry Pi 5, four logical CPUs, 16GB RAM, Linux/aarch64, Python 3.11.2. Same-host 127.0.0.1, HTTP/1.1, one connection per request. A dedicated single-event-loop API, not a benchmark of a particular framework or production application.
- A fresh API process for every run, with two warm-up requests. After all warm-up logs were read, counters were reset before the 20 requests/sec, eight-second measurement. The 14 combinations were repeated in three rounds, rotating the starting position each round. Pilot measurements are excluded.
- The response time at the slower end is the sorted observation at
ceil(count × 0.99). Article points use 480 pooled requests; chart ranges cover three runs of 160 requests each. Short duration and few repetitions limit conclusions about small differences and rare delays. We did not calculate confidence intervals or statistical significance. - CPU is measured with cgroup counters from after warm-up to the end of the response-observation interval, before subsequent statistics retrieval. For queued output, it includes output performed by the listener thread during that interval. It is an API-wide mean; the intervals do not necessarily encompass the same amount of completed logging work across modes.
- API and load-generator/reader each capped at 0.25 cores, with memory limits of 128MiB and 256MiB, plus runtime and output-volume limits. Host-wide CPU, sampled about once per second, had a median of 7.3% and a maximum of 53.9%; maximum load1 was 0.79. These include other work on the shared host. Stop criteria were not reached. Dedicated processes, FIFOs, and temporary files were removed afterward.
- The slow reader waits after each 4,096-byte read; 256KiB/sec is an upper limit. Finishing a read does not mean durable disk storage or acknowledgment by an external service.
- All output was checked by byte count, newline count, and SHA-256. Log contents were discarded rather than stored. Results can differ with servers using other threading models, other languages and loggers, file or network output, or indefinite load.
See the per-condition CSV, all 42 runs, and, for reanalysis, 6,720 request observations and timeline data. A guide to columns and aggregation is included.
About KamuiDash
KamuiDash is a PaaS for deploying web apps from GitHub, with support for a Japan region.