
A web app occasionally responds slowly. Its CPU graph shows less than half of the configured limit in use. If there is CPU capacity to spare, where are requests waiting? It can be hard to decide what to investigate next.
We wanted to test whether the same number of requests can produce slower responses simply by arriving in a short burst. We also compared what happens when we raise the CPU limit.
We sent requests to an API that performs the same calculation each time, either at regular intervals or in batches. With a 0.25-core CPU limit, average usage stayed below half the limit in both cases. Yet the response-time measure we used to compare slower requests differed from about 10 milliseconds to about 202 milliseconds.
The results help identify what to check even when average CPU usage looks low.
Send the same 20 requests per second, evenly or in batches
Our test API performs a fixed calculation for every request. We calibrated it to use about 4 milliseconds of CPU time, then kept the iteration count fixed. CPU time is time spent actually working on a CPU, rather than elapsed time that includes waiting.
We used two arrival patterns:
- Evenly spaced: one request every 50 milliseconds, or 20 per second.
- Batched: eight requests every 400 milliseconds, also averaging 20 per second.
We set CPU limits of 0.25 and 0.5 cores. These settings limit the CPU time available relative to one core running continuously. We will look at how the limit works below.
We measured all four conditions for 20 seconds each, repeated three times in a varied order. All 1,200 requests per condition succeeded, for 4,800 successful requests in total. Communication stayed on the same machine; there was no external network or database access.
Similar average CPU usage, different response times
To include slower responses in the comparison, we sorted each condition's 1,200 response times from shortest to longest and took the 1,188th value, at the 99% position. This is neither the mean nor the single slowest response. We call it the “slower-response measure” in the table and chart. The unit ms means milliseconds; 1,000ms is one second.
| CPU limit | Arrivals | Average CPU usage | Share of limit | Slower-response measure |
|---|---|---|---|---|
| 0.25 cores | Even | 0.103 cores | 41.2% | 10.1ms |
| 0.25 cores | Batched | 0.108 cores | 43.3% | 202.2ms |
| 0.5 cores | Even | 0.107 cores | 21.4% | 10.1ms |
| 0.5 cores | Batched | 0.106 cores | 21.2% | 104.2ms |
Response times pool all 1,200 requests per condition. CPU usage is the mean of three runs. “Share of limit” is relative to the configured CPU limit, not the whole machine.
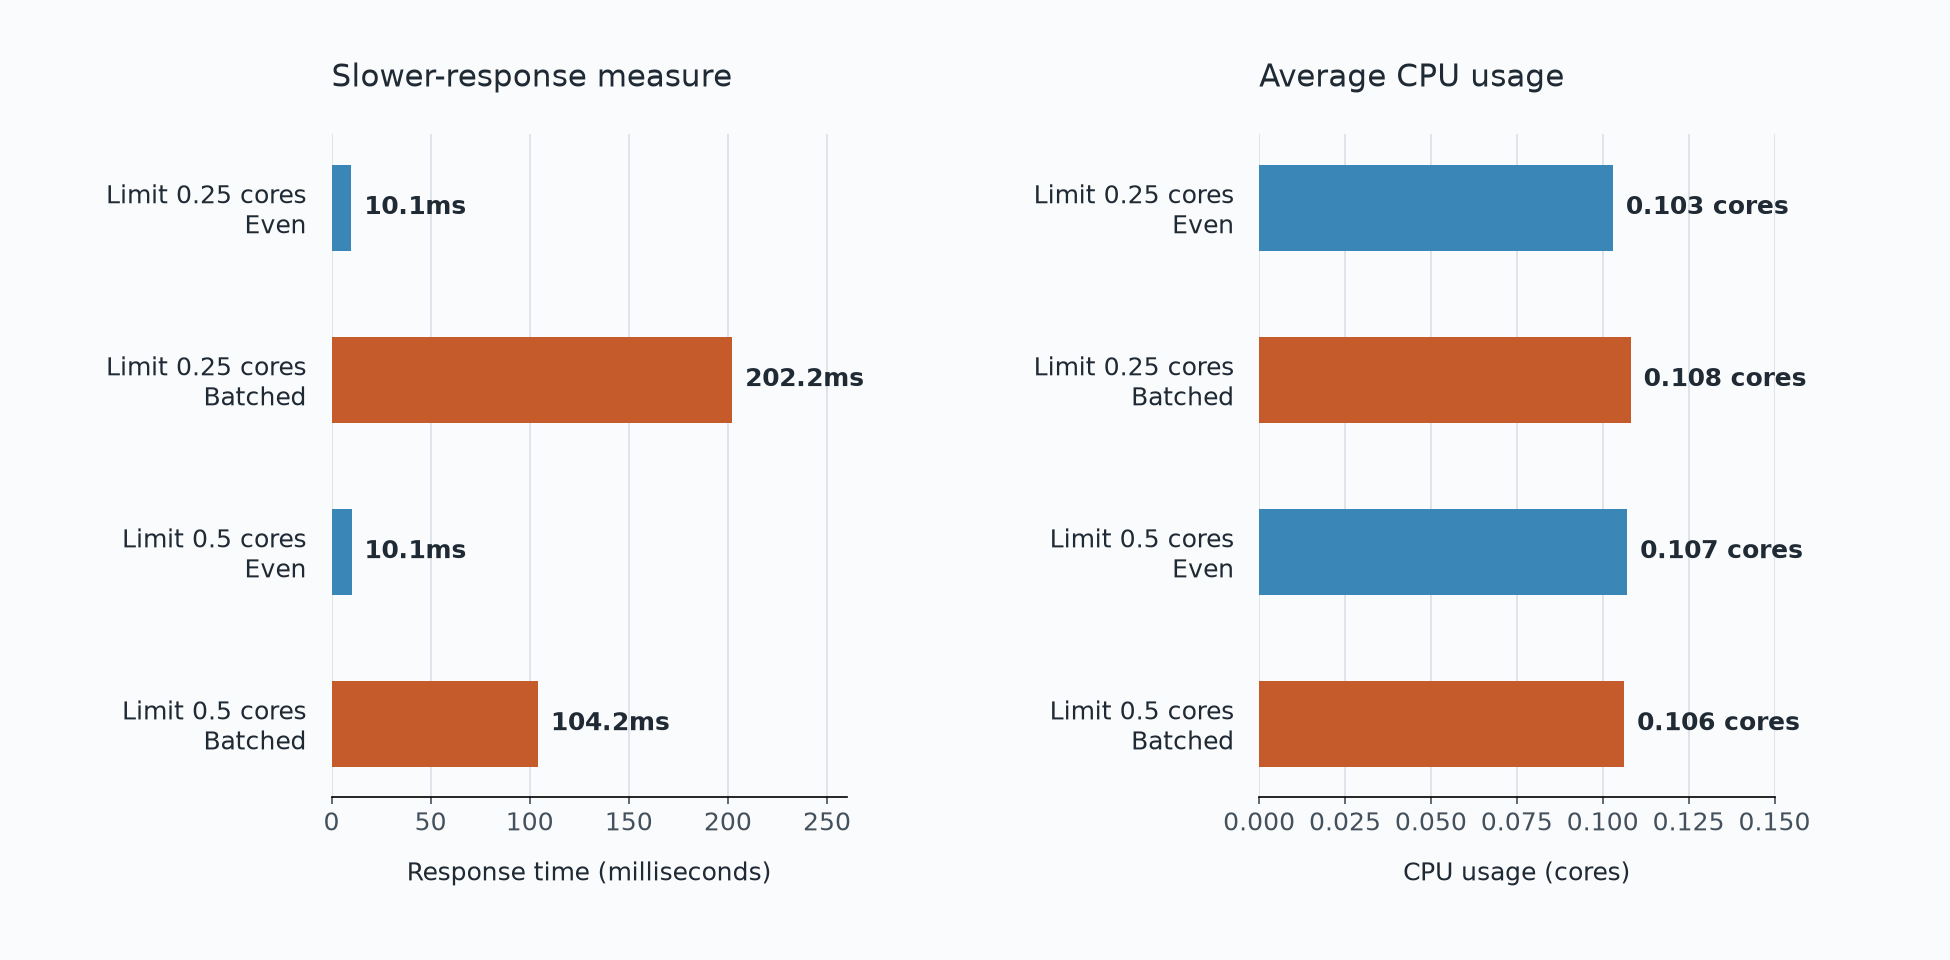
With the 0.25-core limit, average CPU usage remained below half the limit in both cases. But batching requests increased the comparison value from 10.1ms to 202.2ms, about 20 times as long.
Keeping the arrival pattern unchanged and raising the limit to 0.5 cores reduced the batched value to 104.2ms. Evenly spaced requests stayed at about 10ms. In this experiment, raising the CPU limit made a difference when requests arrived in bursts.
Across the three runs, the batched measure ranged from 144.3 to 203.4ms at 0.25 cores and from 69.8 to 105.9ms at 0.5 cores. The exact value varied, but batched requests were slower in all three runs.
Why can't the app use the CPU capacity that seems to be free?
The Linux CPU limit in this experiment does not make the CPU run continuously at one-quarter speed. It sets a CPU-time budget for each short period.
For the 0.25-core condition, the cpu.max file contained 25000 100000. The units are microseconds, so the group can use a total of 25 milliseconds of CPU time per 100-millisecond period. This applies to the group containing the app; it is not a separate 25-millisecond allowance for each request. The official Linux kernel documentation explains the format and CPU-limit statistics.
= about 32ms of CPU time needed
the app can hit its CPU limit
Eight calculations of about 4 milliseconds each need about 32 milliseconds of CPU time in total. HTTP handling adds more work. When work arrives together, it can exhaust the budget within a short period.
The average over roughly 20 seconds, meanwhile, includes time when no requests arrive. Low average usage over a longer interval can coexist with CPU throttling during a burst. That is what an average alone can miss.
We also checked records of CPU throttling
We checked Linux's records rather than relying only on the explanation. The nr_throttled counter in cpu.stat counts periods in which the group was throttled after exhausting its CPU-time budget. We read it before and after each measurement and summed the increases across three runs.
| CPU limit | Arrivals | Periods with throttling |
|---|---|---|
| 0.25 cores | Even | 0 |
| 0.25 cores | Batched | 202 |
| 0.5 cores | Even | 0 |
| 0.5 cores | Batched | 50 |
These are the summed counter increases across three runs, not counts of slow requests or milliseconds spent waiting.
The counter did not increase with evenly spaced requests. It increased with batches at both CPU limits. CPU throttling therefore did occur despite low average CPU usage.
This counter cannot tell us how many milliseconds an individual request waited. Our Python server also has limits on how much calculation it can execute concurrently; waiting for earlier work and switching between tasks affect response times too. We did not test an unlimited-CPU condition, so we cannot attribute the entire roughly 20-fold difference to CPU throttling alone.
What to check when your app behaves this way
Our original question was where requests might be waiting despite apparent CPU headroom. The experiment showed that requests can encounter CPU throttling and slow responses during bursts even when average CPU usage is low. A graph of average usage alone cannot rule out a CPU-related problem.
For an app showing similar symptoms, check in this order:
- Look at requests around the time of the slowdown. Use your usual response-time records or access logs to find when slow responses occurred. Look beyond the total per minute: do timestamps show requests arriving in the same second, or within part of a second? Coarse timestamps cannot establish whether shorter bursts occurred.
- Check whether CPU-throttling records increased over that interval. If your monitoring screen includes “CPU throttling,” use it to check for execution being held back by the CPU limit, and compare it with the slow interval. If you can inspect the app's Linux environment, read
cpu.statfor the group containing that app before and after the interval and comparenr_throttled. If you cannot locate it, ask the operator whether the app hit its CPU limit during that time. - If throttling coincides with the slowdown, change only the CPU limit in a development environment and compare. Keep request count, burst pattern, and work per request unchanged, and compare both response times and throttling records. Here, raising the limit shortened batched responses but barely changed evenly spaced responses. Check the effect on your app before deciding to change its limit.
If increasing the CPU limit does not help, investigate other waits such as database queries or external calls. A counter that does not increase is not conclusive either: you may be looking at the wrong group, or a parent group may have a separate limit.
Rather than stopping at “CPU usage is low,” compare the time of slow responses with bursts of requests and records of CPU throttling. The experiment gives you a way to choose what to investigate next.
Measurement conditions and interpretation
We measured response time from the scheduled send time until the response body had been fully read. This includes any delay in the load generator starting a request. For that starting delay, the value at the 99% position ranged from about 1.1 to 5.7 milliseconds across conditions.
Send times were scheduled independently of earlier responses. This avoided reducing the offered request rate, and weakening the bursts, when responses were slow.
- Environment: Linux, four logical CPUs, cgroup v2, on a shared machine running other work.
- Server: Python 3.11 ThreadingHTTPServer, HTTP/1.1 connection reuse, TCP_NODELAY enabled.
- Calculation: 5,025 SHA-256 iterations per request. Median calculation CPU time during calibration was about 4.0 milliseconds.
- Generator: same machine, at most eight concurrent requests; one every 50 milliseconds or eight every 400 milliseconds.
- CPU limits: 0.25 and 0.5 cores, 100-millisecond period, no additional CPU bandwidth limit from a parent group.
- Measurement: three 20-second runs per condition in a varied order; server restarted each run; warm-up excluded.
- Response-time aggregation: the 1,188th of 1,200 sorted values per condition. Each individual run uses the 396th of 400 values; reported ranges are the minimum and maximum of three runs.
- CPU aggregation: the increase in
cpu.stat'susage_usec, converted to seconds and divided by the CPU observation interval, then averaged across three runs.
CPU observation started about 0.1 seconds before scheduled requests began, so the denominator is about 20.101 seconds. It differs from the CSV's duration_s, which measures about 20 seconds from the scheduled start. runs.csv includes a denominator derived from recorded CPU usage and an estimate from separate timestamps. See the data notes for details.
In this CPython 3.11 server, the GIL restricts concurrent execution of Python code across threads; see the official Python documentation. We did not isolate other workloads or execution-order effects. Actual CPU time varies even with a fixed iteration count. This experiment does not establish the same timings or multiplier for other machines or apps.
Measurement data and experiment code
- Aggregated results by condition (CSV)
- Results for all 12 runs (CSV)
- All 4,800 request measurements (CSV)
- Data notes
- Experiment script (Python)
The reproduction script targets Linux environments that can apply CPU limits through systemd user services.
Deploying your web app
Want to run a web app from GitHub in a Japan region? KamuiDash lets you deploy an app from its repository.