
We created 80,000 small objects in Python and dropped references to more than 98% of them. In one case, memory usage barely fell.
“Dropping a reference” means removing a connection to data from a variable or list. Garbage collection (GC), on the other hand, reclaims data that the program can no longer use. Running GC does not reclaim data that is still accessible through another variable or list.
We had kept a reference to just one object in every 64. Running GC manually barely changed memory usage. But when we dropped those last references too, usage fell substantially.
Discarding most of the data and running GC did not reduce usage; letting go of the last few objects did. This gives us a way to distinguish “we have finished using the data” from “the OS sees lower memory usage.”
This article uses four cases to understand what remained, then connects the results to what to investigate when memory usage stays high after work finishes.
We measured RSS (Resident Set Size): the amount of a running program's (process's) memory currently resident in physical memory (RAM). RSS includes code and shared libraries as well as Python data, so it is not the same as the amount of live Python data. Linux RSS documentation
The experiment produced three different outcomes: RSS fell immediately after dropping references, stayed high until GC reclaimed objects, or stayed high even after GC because we retained a few references. We use these differences to work out an order for investigating post-work memory usage.
Compare four cases after dropping references
We used CPython 3.11.2 on Linux 6.12, aarch64, and glibc 2.36. Python's standard small-allocation manager, pymalloc, was enabled. We compared four cases.
| Case | What we allocate | What “discard” means |
|---|---|---|
| Large buffer | One 32 MiB bytearray | Drop its reference |
| Small buffers | 80,000 bytearray(256) objects | Drop the entire list |
| Sparse retention | The same 80,000 buffers | Keep every 64th buffer, or 1,250 objects, in another list |
| Reference cycles | 80,000 Nodes, each with a self-reference and a bytearray(256) | Drop the outer list |
The 256 is the number of payload bytes in each bytearray. Objects and lists need additional bookkeeping, so the RSS increase is not simply 80,000 × 256 bytes.
We measured each case in three fresh processes, with two cycles inside each process. We recorded memory immediately after dropping references, one second later, and three seconds later, then called gc.collect(). In the sparse-retention case, we subsequently released the remaining references too.
What the experiment showed: discarding data does not always have the same effect
| Case | After allocation | Just after dropping references | After 3 seconds | After full GC | After releasing retained references |
|---|---|---|---|---|---|
| Large buffer | +32.00 | +0.00 | +0.01 | +0.01 | +0.01 |
| Small buffers | +25.87 | +0.86 | +0.86 | +0.84 | +0.84 |
| Sparse retention | +25.90 | +25.61 | +25.61 | +25.61 | +0.45 |
| Reference cycles | +30.32 | +30.02 | +30.02 | +0.90 | +0.90 |
Values are in MiB: the median increase in RSS above each cycle's pre-allocation baseline. One MiB is 1,048,576 bytes. We combine six observations from three processes × two cycles, without treating the two cycles within a process as independent repetitions.
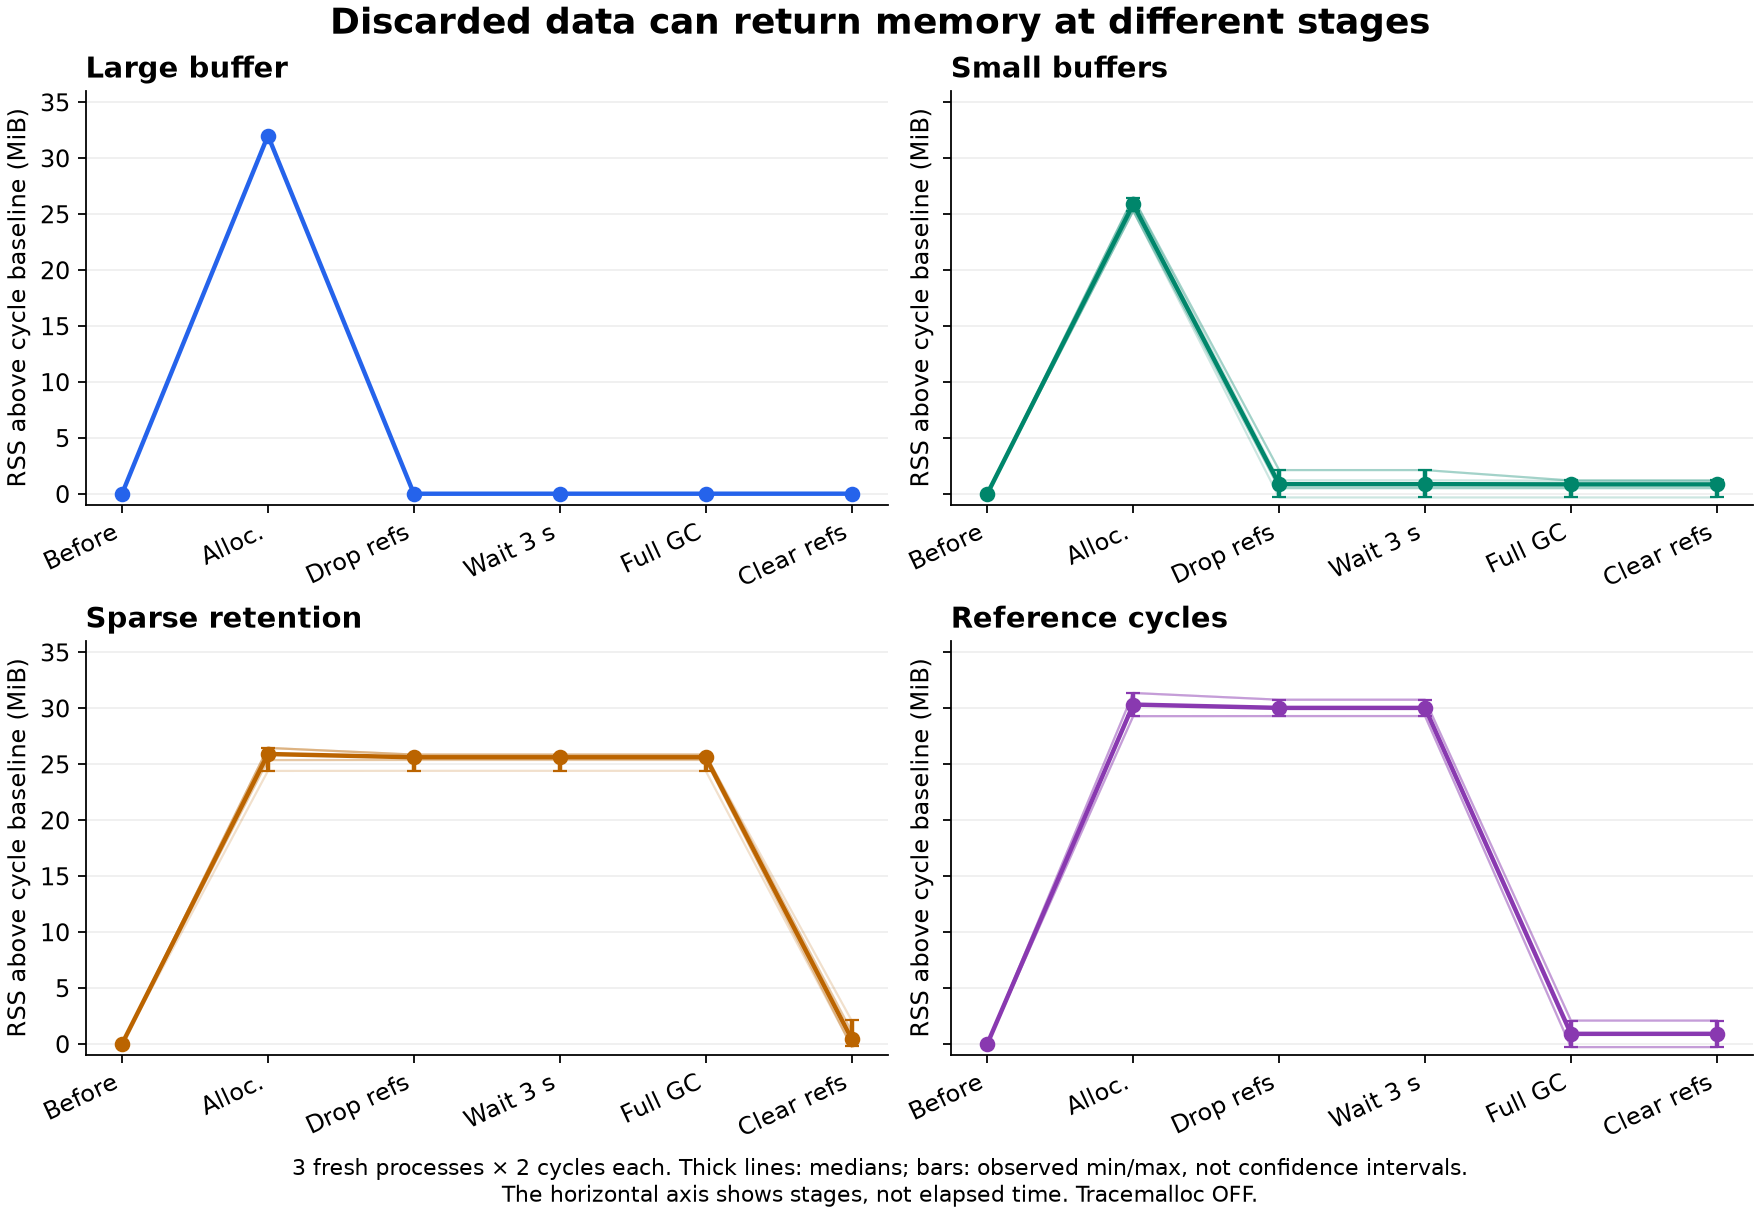
The table shows that what needs to happen after “discarding” data depends on the state of its references.
- For the single 32 MiB buffer, the RSS increase returned almost to zero immediately after dropping its reference. Small buffers also lost most of their RSS increase immediately when we dropped all their references.
- With reference cycles, about 30.02 MiB of additional RSS remained after three seconds; manual GC reduced it to about 0.90 MiB.
- Keeping one in every 64 small buffers—about 1.6%—left about 25.61 MiB of additional RSS even after GC. Dropping the last references reduced it to about 0.45 MiB.
Neither “wait and it will fall” nor “run GC and it will fall” explained every case. In particular, discarding more than 98% of the data did not reduce RSS by the same proportion. To understand why, we need to look at how memory is managed.
Why the outcomes differ: references, collection, and returning memory to the OS
- 1. Object lifetime
Reference counting and cyclic GC reclaim Python objects that are no longer needed.
Observe references, GC collection counts, and Python-traced allocations. - 2. Free allocator space
The allocator can reuse free blocks for subsequent allocations.
Examples: pymalloc and glibc. Paths depend on allocation size and other factors. - 3. OS-resident pages
RSS falls when fewer physical pages are mapped into the process.
Observe RSS, PSS, Anonymous, and Swap.
Once Python reclaims an object, the space used for it can be reused. But if the allocation manager—the allocator—keeps that space, the OS-visible resident memory need not fall immediately. Python's memory-management documentation describes multiple allocation and caching mechanisms inside Python.
Reference cycles were not collected during three seconds of waiting
CPython uses reference counting, supplemented by a collector that finds reference cycles. This Node, for example, keeps a reference to itself.
class Node:
    def __init__(self):
        self.link = self
        self.payload = bytearray(256)

nodes = [Node() for _ in range(80_000)]
del nodes  # The outer list disappears; each Node still refers to itself.
This is a simplified illustration of the relationship. The measured implementation also fixed details such as using __slots__ to avoid a separate attribute dictionary.
For the cyclic case, we first ran a full collection while retaining all Nodes in the outer list and confirmed that zero were collected. This preliminary collection also changes the objects' generations. After we dropped the outer references, RSS was almost unchanged three seconds later, and all 32 sampled objects were still alive.
Manual GC then collected 80,000 Nodes every time, and none of the sampled objects remained alive. The median RSS increase fell from about 30.02 MiB to about 0.90 MiB. The collection count is the number of Nodes, not the number of their attached bytearrays.
Automatic GC was enabled, but the observed GC event count did not increase between dropping the references and the three-second observation. CPython 3.11 uses allocation and deallocation counters to trigger automatic collections; elapsed seconds alone do not determine collection time. Our workload also performs almost no new work while waiting after that preliminary collection. GC behavior
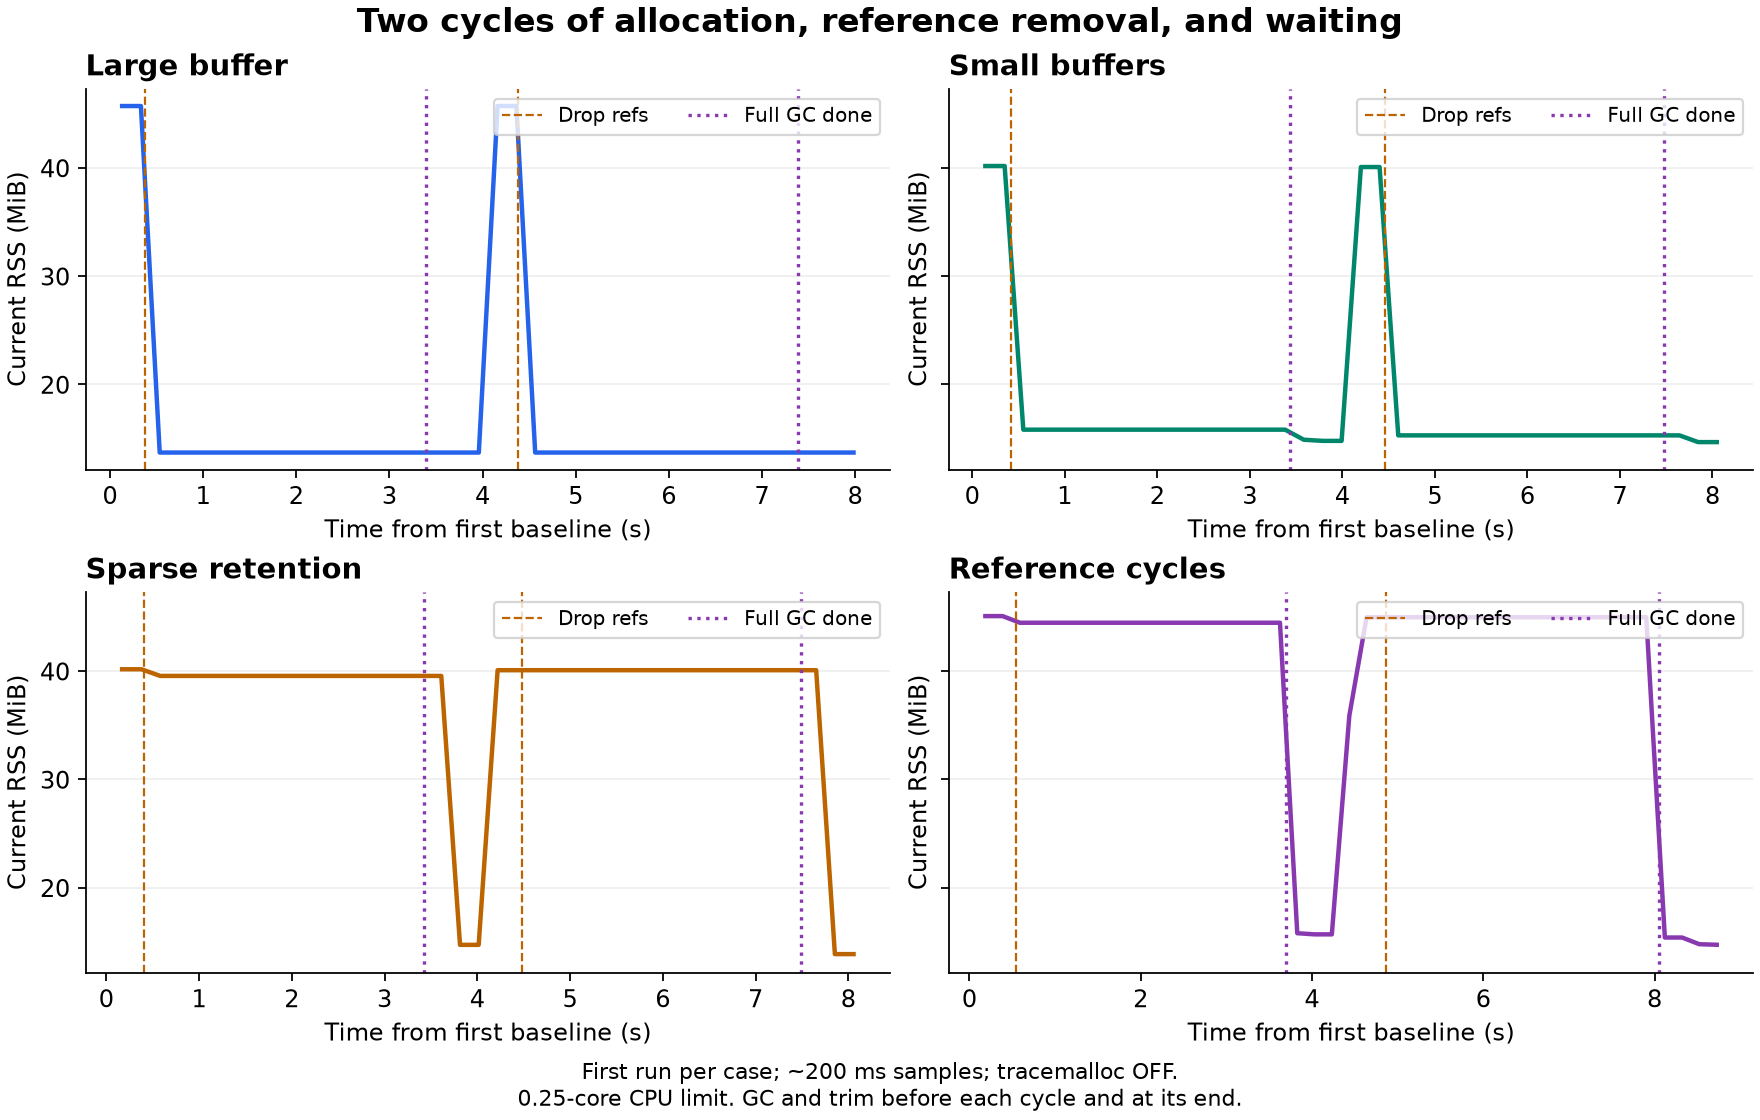
Manual collection took a median of 146.9 ms of wall time and 38.8 ms of process CPU time. With a 0.25-core CPU limit, wall time includes time spent waiting for CPU access. It is not a measurement of GC pause time for a production application.
Why can keeping about 1.6% retain a much larger region?
The sparse-retention case kept 1,250 of the 80,000 objects in a list. GC cannot simply discard objects that still have live references. But those buffers represent only about 1.6% of the original count and payload. RSS might seem likely to shrink to a similar fraction; that is not what we observed.
pymalloc handles small allocations of 512 bytes or less. On 64-bit platforms it uses regions called arenas, each 1 MiB in size, containing smaller allocations. Reusing a free block is different from returning an entire arena. pymalloc documentation
An entirely free region becomes a candidate for release.
The whole region cannot be discarded while preserving the live objects in place.
Free block Live object
The large RSS reduction after releasing the last references is consistent with regions being retained in this way. However, we did not inspect every arena's layout or compare alternative allocators. We have not attributed the entire residual RSS to a particular internal structure.
What to check next time memory usage stays high
Start with the memory-monitoring display you normally use and Python's print(). In a development environment, look at both post-work memory usage and the number of items your code retains.
1. Repeat the same work and note the memory readings
Find the Python process in your OS's process list or your usual application-monitoring display and open its memory usage. If you do not know which process to inspect, run this inside the Python program you are investigating to get its process ID (PID). os.getpid documentation
import os
print("This Python process's PID:", os.getpid())
Keep that Python process running. Repeat the same work several times with the same input and workload size, noting memory usage immediately after each run finishes. Does usage stay roughly level after an initial increase, or does it increase every time? Do not mix in readings from restarting Python for every run: ending the process also removes what has accumulated in it. A few level readings alone do not prove the absence of a memory leak.
Compare the same field in the same display. A monitor's “memory” field does not necessarily mean RSS, and you do not need to compare its absolute value with this article's RSS measurements. A “maximum usage” field records a historical peak, so it cannot show whether current usage fell after work finished. The supplement below explains how to read RSS directly on Linux.
2. Print the number of items in lists or dictionaries holding results
If your code appends results to a list called results, put these lines around the operation. Replace results with your own list's name and run_job() with the work you want to investigate. Inspect the list that actually holds results, rather than creating a new empty list for this check.
print("Items before:", len(results))
run_job()  # Replace with your own operation.
print("Items after:", len(results))
len() returns the number of items in a list or dictionary. If you save data in a dictionary called cache, print len(cache) in the same way. len documentation
Look for results that remain and accumulate after each run, even though you have finished using them. For example, if you only use the current run's results but keep appending past results to a list, check whether that storage is necessary. Necessary history or a growing cache is not inherently a bug. Also, memory usage can grow with the same item count if each item gets larger.
3. Fix unnecessary retention and compare under the same conditions
Consider stopping the accumulation of old results you no longer need, removing items from a list after use, or setting a size limit or expiry policy for a dictionary cache. Check why data is retained before changing the code; do not indiscriminately delete data that is still needed.
For both the original and revised code, finish startup initialization, then repeat the same workload with the same input. Immediately after each run, record memory usage and the number of items in the relevant list or dictionary. Compare how the counts and memory readings change across runs. Do not use readings from restarting the process after every run to judge cumulative growth.
In our experiment, keeping even a few references prevented GC from making a difference; dropping the last references substantially reduced RSS. The practical action is to check whether your own lists or dictionaries still hold data you have finished using before adding GC calls. We did not measure the effect of changing a cache design, and this does not guarantee an immediate RSS reduction in another application.
If item counts offer no clue, check individual data sizes and other places where data is stored. If you still cannot locate the growth, move on to the more detailed investigation in the supplement. Item counts cannot explain all memory usage.
This experiment has only two cycles, with GC and trim during the sequence. It does not establish long-term leak behavior or convergence under natural idle conditions, nor does it test calling GC or trim on every request as a remedy.
Supplement: use tracemalloc if you cannot locate the growth
To find where Python-side memory grows, compare records from before and after the work with tracemalloc. This is example diagnostic code to put in the application under investigation. Replace run_same_job() with your own operation using the same input. Finish application initialization and start tracing before the work you want to compare.
import tracemalloc

tracemalloc.start()
before = tracemalloc.take_snapshot()

run_same_job()  # Replace with the operation under investigation.

after = tracemalloc.take_snapshot()
changes = after.compare_to(before, "lineno")
increases = [change for change in changes if change.size_diff > 0]
for change in increases[:10]:
    print(change)
The output includes filenames, line numbers, and differences in memory allocated from those locations. Start with lines showing large increases, then follow where the code passes the data they create—for example, into a list or cache. The output identifies allocation sites; it does not directly identify where references are currently held. Comparing tracemalloc snapshots
Tracing itself uses memory. It does not capture allocations made before tracing starts or every native allocation. Do not directly compare RSS with and without tracing; first use it to locate growing Python-side allocations. If you suspect reference cycles, check for self-references like the earlier Node example, along with GC events and collection counts.
If Python-traced allocations return to their earlier level while RSS remains high, that fact alone does not establish that Python references remain. Native extensions and shared pages are also investigation candidates.
Supplement: Linux pages and interpreting memory metrics
The OS manages memory mainly in units called pages, rather than in Python variables or list elements. In this environment, a page was 4 KiB. A virtual address is an address as seen by a process, which can be mapped to a physical page in RAM. Reserving an address range and providing physical pages for its entire extent need not happen at the same time.
For anonymous memory, which has no particular file backing it, Linux can provide pages when they are accessed. An allocated size alone does not establish how much RAM is in use. We explicitly wrote to every page of the 32 MiB buffer. Linux malloc notes, virtual-address mappings
Conversely, reclaiming an object inside Python does not automatically tell the OS where the resulting free blocks begin and end, or that Python no longer needs them. Making space reusable inside Python and returning it to the OS are separate operations.
RSS can fall while virtual addresses remain mapped
munmap() removes a mapping from the virtual address space. By contrast, madvise(..., MADV_DONTNEED) can tell the kernel that pages in a range are no longer needed while retaining the mapping. For a private anonymous mapping, later access provides zero-filled pages again. munmap, MADV_DONTNEED
If we use a reduction in RSS to mean “returned to the OS,” the size of the virtual address space need not fall at the same time. We did not trace system calls in this experiment. The large buffer's immediate RSS reduction alone does not prove that munmap() was called.
Different metrics count different things
RSS is not the size of Python's live data. It also includes code, stacks, shared libraries, file mappings, and more. Shared pages count toward each process's RSS, so summing RSS across processes does not give the machine's total memory usage. smaps documentation
Linux also has cgroups, which manage resources for groups of processes. The following metrics distinguish one process's resident memory, usage adjusted for sharing, and usage charged to a whole group.
| Metric | What it describes | How to read it here |
|---|---|---|
| Virtual memory size | The size of a process's virtual memory space | Not all of it is resident in RAM |
| RSS | Process pages currently resident in RAM | Includes more than live Python objects |
| PSS | Private pages in full, plus a proportional share of shared pages | Helps compare usage while accounting for sharing |
| Anonymous | Memory currently in RAM that does not belong to a file | Shows anonymous memory such as heap pages |
| Swap | Memory moved out to swap | Helps consider whether RSS fell while data remained live |
| cgroup memory.current | Usage charged to a group and its descendants | Includes page cache and kernel memory, among other things; differs from RSS |
Linux can reduce RSS through swapping, for example, even while objects remain alive. Conversely, RSS can remain high while an allocator has free space. RSS changes alone cannot establish whether Python's live data has grown or shrunk.
For container or service limits, examine cgroup metrics. memory.current is not a substitute for one process's RSS; memory.stat provides a breakdown including anonymous and file-related memory. A memory.max limit can cause an out-of-memory (OOM) condition inside the group even when the host has spare memory. cgroup v2 memory documentation
A host can also have little completely free memory while holding reusable page cache. MemAvailable estimates how much is available for new work. That does not mean the anonymous-memory RSS retained in this experiment can simply be explained as disk cache. Linux MemAvailable
On Linux, specify the target process's PID and read the Rss: line below. Values are labeled kB; divide by 1024 to express them in MiB. Choose a process you have permission to inspect.
pid=12345  # Replace with the target process's PID.
cat "/proc/$pid/smaps_rollup"
When using a monitoring display, check that it shows current RSS. ru_maxrss and VmHWM record historical peaks, so they cannot tell you whether current usage falls after work finishes. Linux proc documentation
memory.events helps investigate events such as OOM. A level process RSS does not necessarily mean the service as a whole has enough memory headroom.
Supplement: tracemalloc and malloc_trim diagnostics in this experiment
We also ran a separate tracemalloc diagnostic once per case. In sparse retention, the increase in live Python-traced allocations fell from about 24.57 MiB to about 0.39 MiB. This is a traced-allocation measurement, not RSS. Tracing itself changes RSS, so we kept this diagnostic separate from the main RSS measurements. tracemalloc documentation
At the end of each cycle, we also tried glibc's malloc_trim(0) to return free memory to the OS. This is an allocator diagnostic, not garbage collection. In the uninstrumented main measurements, it did not produce a large additional reduction after GC or after releasing all references. It does not guarantee that all free space will be returned, and it cannot collect data with live references. malloc_trim documentation
Measurement conditions, variation, and supporting data
Only one measured process ran at a time. Its limits were 0.25 CPU core, a 10 ms quota period, 128 MiB of memory, no swap allowance, and a 45-second runtime. The controller had separate limits of 0.10 core and 128 MiB. Neither the load-safety stop criteria nor OOM was reached. We removed the experiment's temporary services, processes, and files afterward.
Before each cycle, we ran full GC and malloc_trim(0), then used that point as the baseline for RSS increases. Each subsequent cycle inherits the same process's earlier history. Some differences are below the baseline; they do not mean negative memory usage. Automatic GC kept its standard settings.
Three seconds after dropping references, RSS increases ranged from 0 to +0.016 MiB for the large buffer, −0.328 to +2.117 MiB for small buffers, +24.398 to +25.852 MiB for sparse retention, and +29.289 to +30.758 MiB for reference cycles.
We recorded GC events in a preallocated, fixed-size numeric array to reduce the chance that instrumentation objects would retain allocation regions. The small allocations made by observation itself were not eliminated entirely.
See the phase measurements CSV, RSS timeline sampled at approximately 200 ms intervals, and data guide. These files omit internal host details and distinguish the main measurements from the tracemalloc diagnostic.
Conclusion: first check whether you are retaining finished results
In this experiment, discarding more than 98% of the data barely reduced RSS, even after GC, while a few references remained. Dropping those last references produced a large reduction.
If memory usage similarly stays high in a Python application, start with these three checks.
- Keep the same Python process running, repeat the same work, and note memory usage immediately after each run. Use the same field in your usual monitor to see whether usage grows every time.
- Print the number of items in result lists or dictionaries before and after the work with
print(len(...)). Check whether finished results remain and accumulate after each run. - If you find unnecessary storage, fix it and compare again under the same conditions. Look at how item counts and memory usage grow across runs.
Our answer to “what should I investigate when memory usage does not fall?” is to record repeated post-work readings and check for lists or dictionaries that still hold data you have finished using. A lack of an immediate memory reduction does not, by itself, mean the fix failed. If item counts offer no clue, or growth continues after a change, move on to the detailed investigation in the supplement.
About KamuiDash
KamuiDash is a PaaS for deploying web apps from GitHub, with support for a Japan region.